Michelson's Analyser
1898 · Spring Summation · Work 643 of 1,871
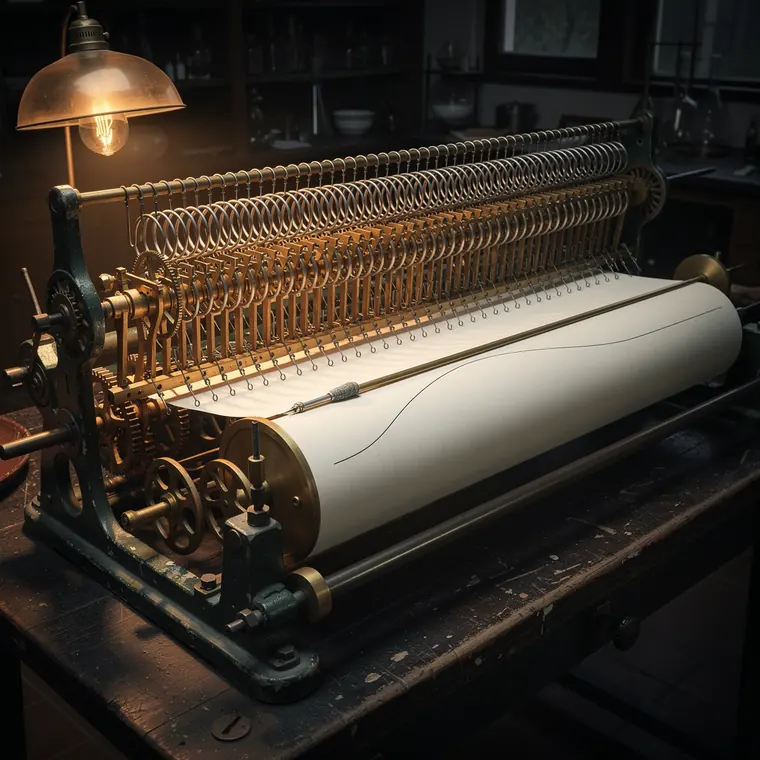
Eighty helical springs hung in a long rack, a dense row of fine coil springs each stretched a different amount so their lower ends form a rising and falling profile along the rack, the combined pull of the springs gathered by a lever train into one balance arm, the arm carrying a single drawing pen resting on a sheet of plain paper wound on a drum, the drawn curve a single fine ink line, the springs steel, the rack and levers brass on a cast iron bed, in a university physics laboratory at the turn of the century, light from one shaded gas lamp raking along the row of springs, the laboratory beyond in darkness.
- What it was used for
- Albert Abraham Michelson was a physicist in Chicago. His work on the light frequencies of a flame required Fourier analyses again and again, so he had a machine built to take over that arithmetic. The Science Museum describes it as a mechanical analog computer that breaks a function down into simple sinusoids and can also recombine them. It was built by William Gaertner & Co. of Chicago. The first instrument, with 20 elements, was made in 1897; the 80-element instrument about a year later. Michelson and Samuel Wesley Stratton described it in 1898 in "A New Harmonic Analyzer" in the American Journal of Science. The London example was acquired in 1904 and was later used for curve analysis at de Havilland Aircraft Co Ltd and at the Admiralty Research Laboratory.
- What was new
- Michelson took Kelvin's tidal analyser as his model and, in the Science Museum's description, replaced the tensioned cords with elastic springs; this raised the number of terms, to 20 in the first instrument of 1897 and to 80 in the London one. The barb: in autumn 1898 Michelson questioned in a letter to Nature whether Fourier series represent discontinuous functions adequately at the point of discontinuity, and on 13 October 1898 A. E. H. Love deplored his apparent ignorance of elementary mathematics. Josiah Willard Gibbs at first described the limiting curve in December 1898 without an overshoot and corrected himself only in April 1899: the vertical segments of the sawtooth extend beyond the slanted parts; Maxime Bôcher later called this Gibbs' phenomenon. Michelson seems to have met the effect while building his analyser but did not cite its results as evidence.
What the sources leave open: The Nature letters of Michelson, Love and Gibbs were not consulted in the original but through R. Herman (UNC Wilmington) and the Henri Poincaré Papers. Herman's narrative attributes the overshoot already to Michelson's October letter and Gibbs's December 1898 letter; according to the Poincaré Papers and Herman's own timeline, Gibbs described it only in April 1899. Volume details for Michelson and Stratton 1898 are inconsistent, so only title, journal and year are given here.